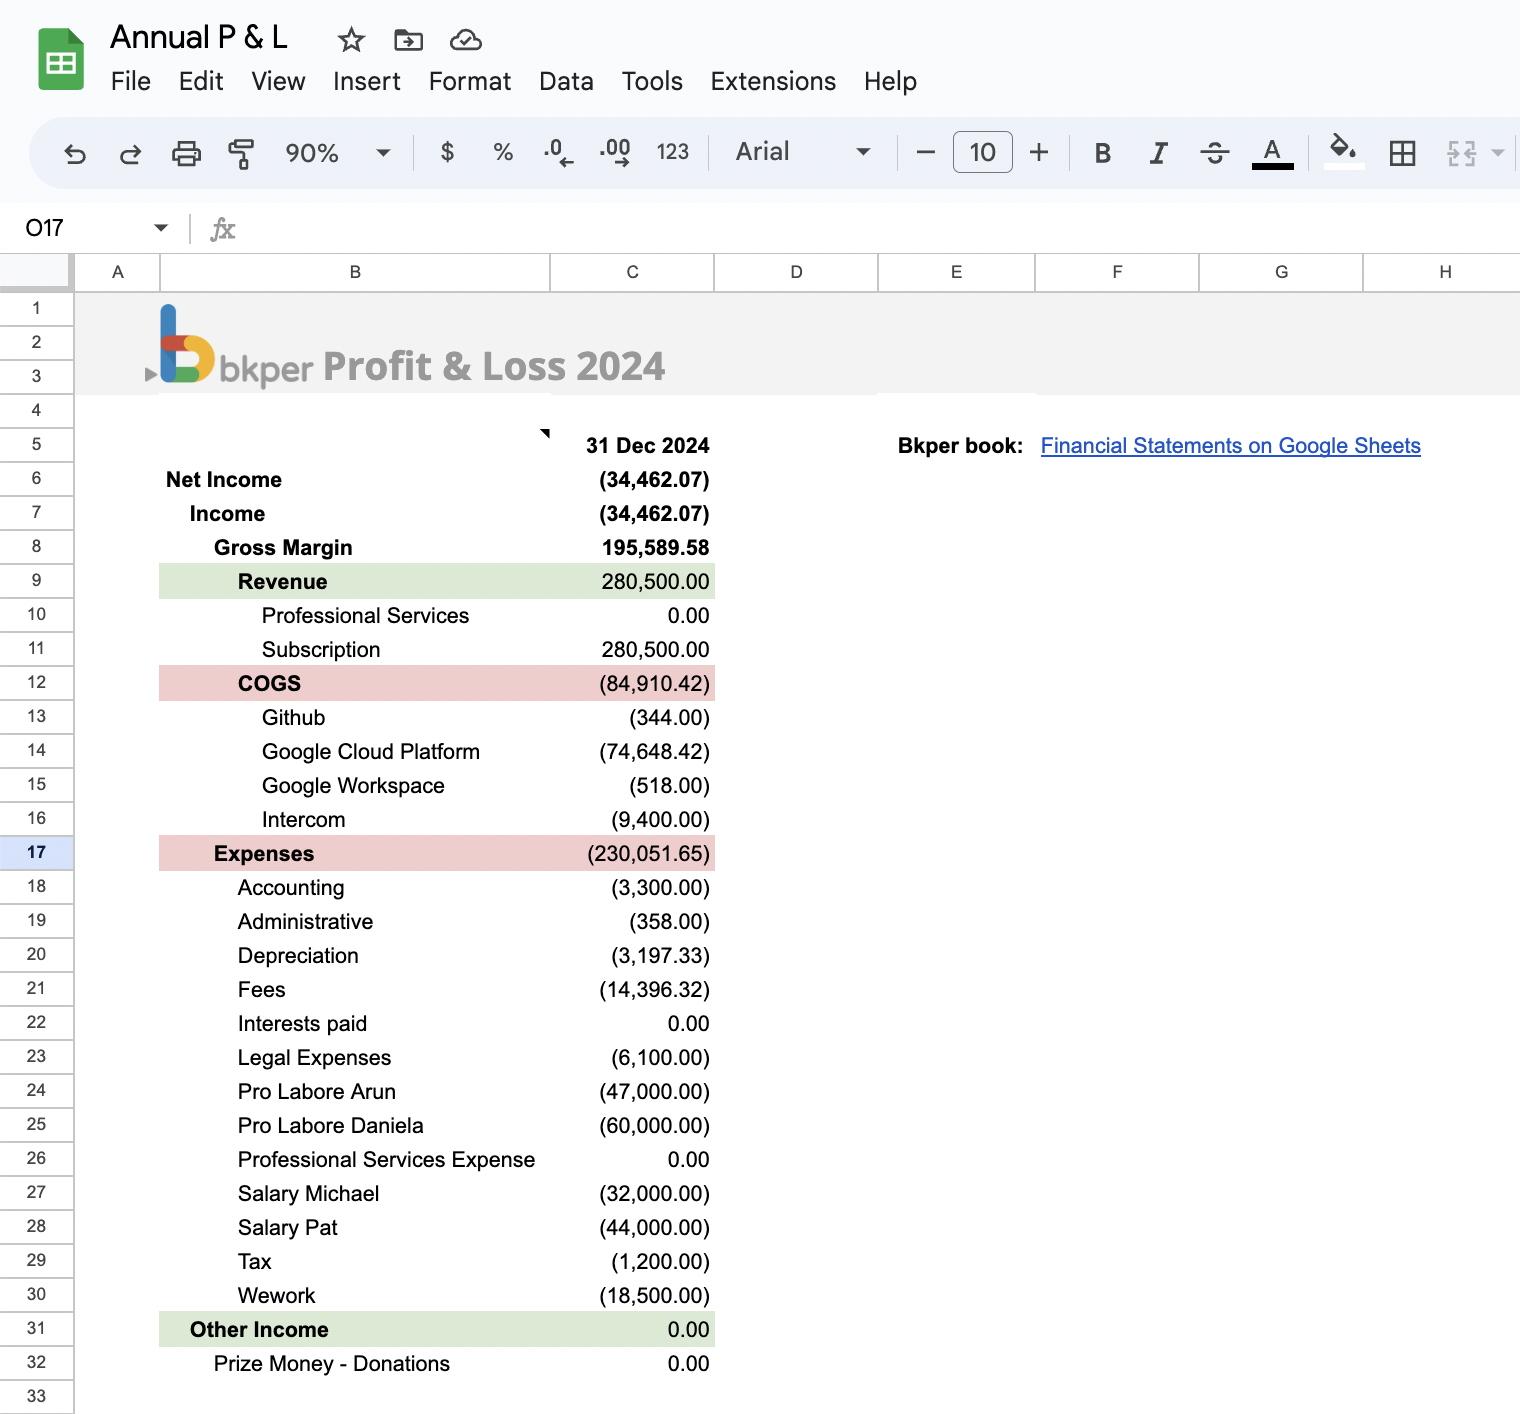
Profit and Loss Report
Fetch data from a Bkper book and build a dynamic P&L statement on Google Sheets using the Bkper Add-on and Bkper Functions.
This guide walks through how to fetch data from a Bkper book and use Google Sheets to produce a Profit & Loss statement. Beyond the P&L itself, it explains how each piece connects so you can build your own reports.
The key parts
A Bkper book is a ledger that tracks transactions between accounts. Each posted transaction updates the balance values of both accounts, keeping balances consistent over time.
The chart of accounts on a Bkper book organizes accounts into categories that can resemble a Balance Sheet and an Income Statement, or be structured around more managerial categories.
The Bkper Add-on for Google Sheets integrates Bkper with Google Sheets, enabling you to fetch financial data from a book directly into a spreadsheet.
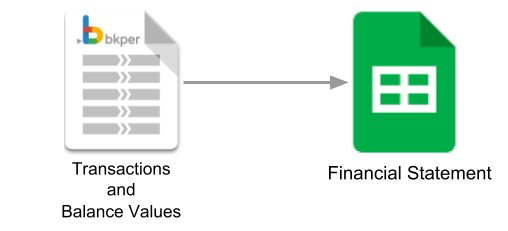
A Bkper Function is inserted into the Google Sheet by the Add-on to maintain a live connection to your book. From that point on, each newly posted transaction automatically updates your P&L report.
Working example
To follow along, use these samples (you can make your own copies to experiment):
Chart of accounts
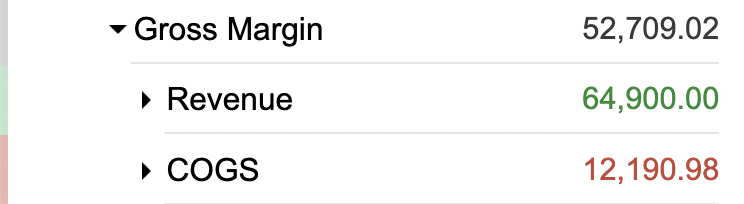
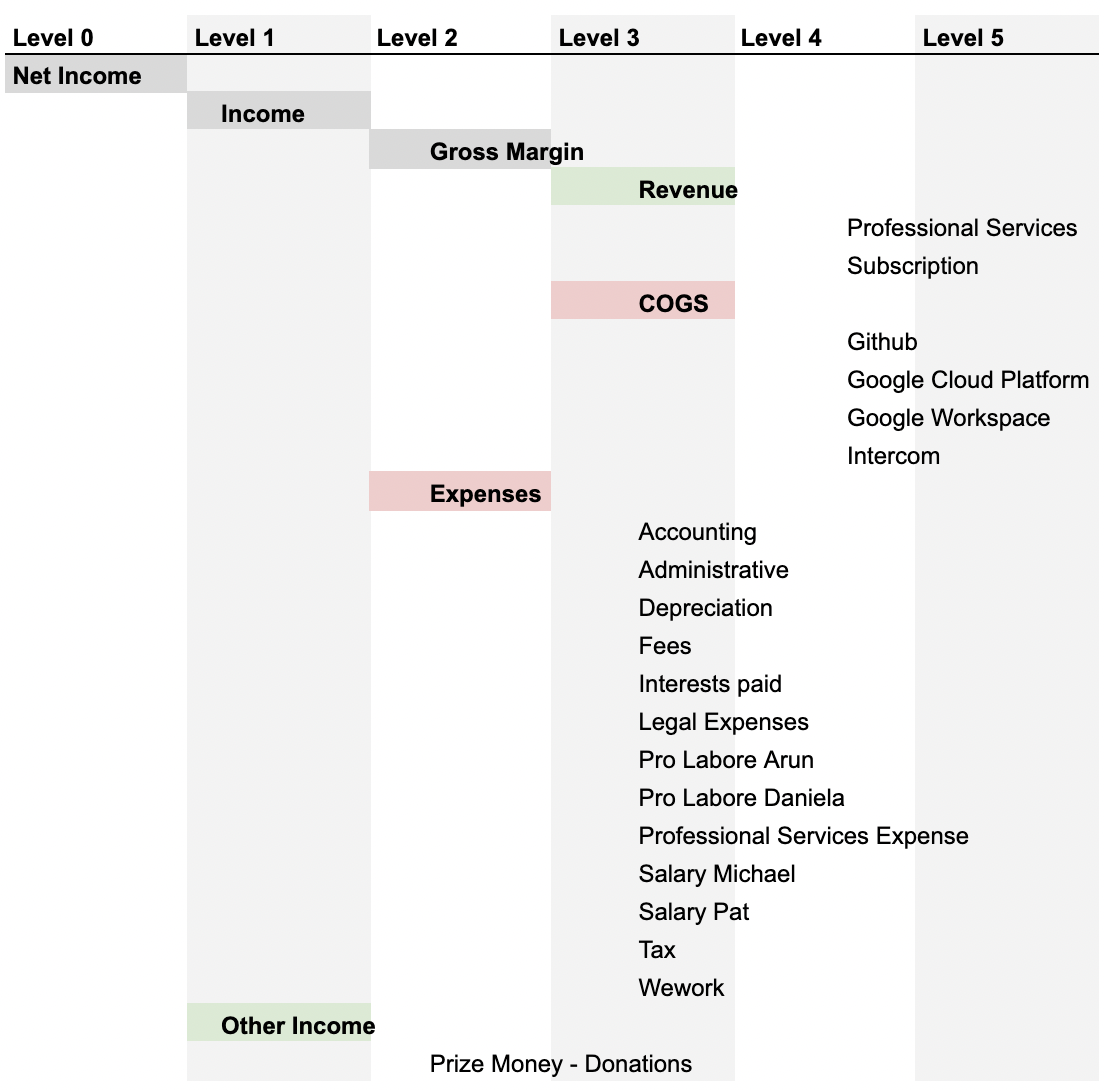
A well-organized chart of accounts is essential to a P&L report — its structure should reflect the data you want to present.
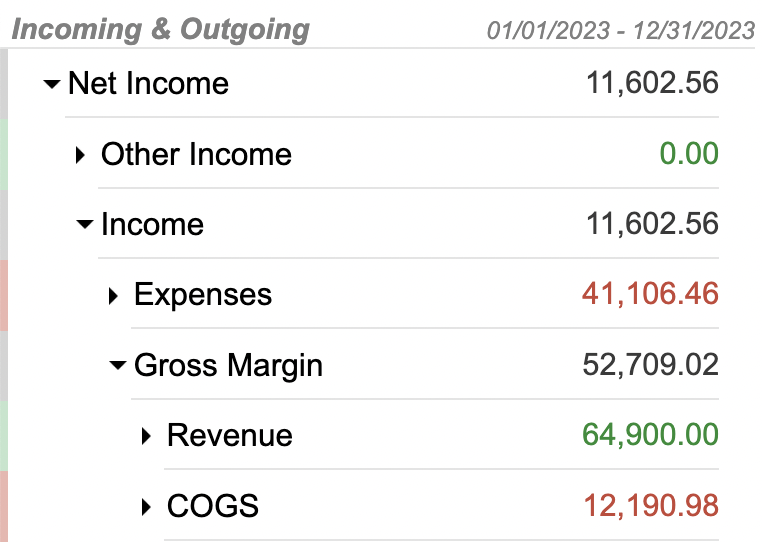
Bkper’s group hierarchy lets you organize accounts to mirror accounting definitions. For example, Gross Margin = Revenue - Cost of Goods Sold.
This hierarchy continues: Income = Gross Margin - Expenses, and further, Net Income = Income + Non-operational income.
Learn more: Groups
The Bkper Add-on for Google Sheets
The Bkper Add-on sidebar opens within Google Sheets, where a form on the Fetch tab helps you define the scope of data to retrieve.
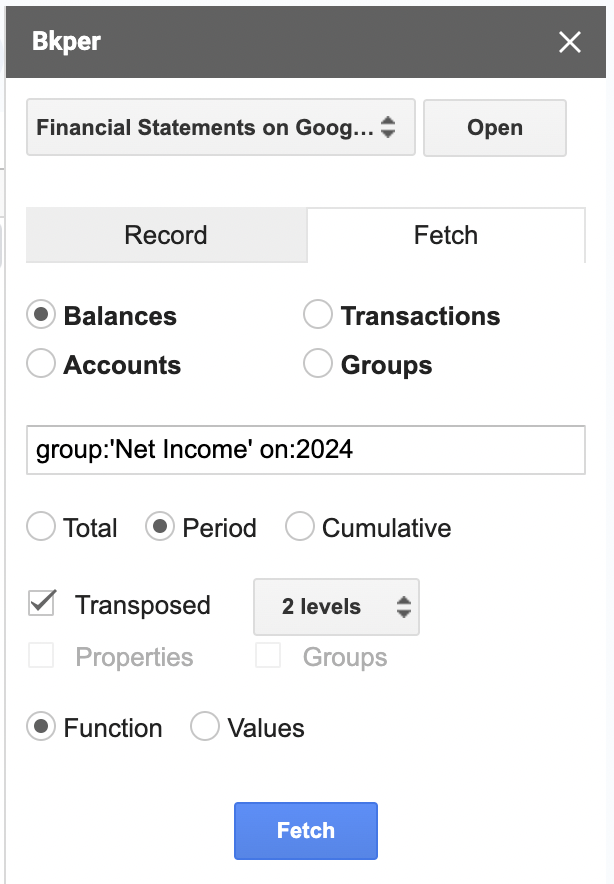
In this example, the query field is set to the Net Income group for the year 2024. Pressing the Fetch button inserts a Bkper Function into the sheet that retrieves the corresponding data:
=BKPER_BALANCES_TOTAL("agtzfmJrcGVyLWhyZHITCxIGTGVkZ2VyGICAwMWc48ELDA", 1, "group:'Net Income' on:2024", 2, FALSE, FALSE)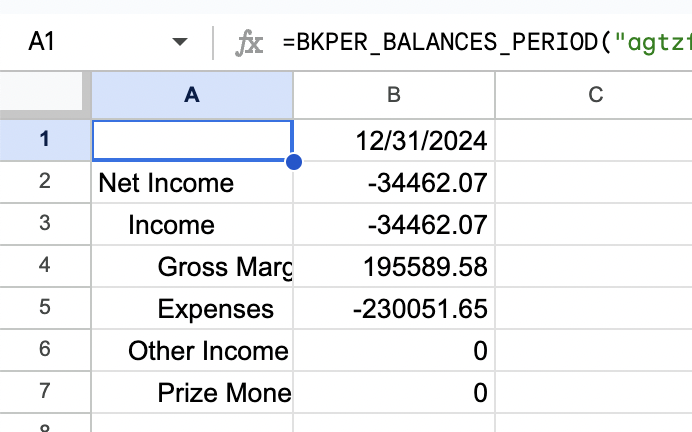
Learn more: Bkper Add-on for Google Sheets | Build Your First Report | Bkper Query Guide
The Bkper Function
The Bkper Function may look complex at first, but the Add-on sidebar can generate it for you. In cell B5 on the P&L sheet:
=BKPER_BALANCES_PERIOD("agtzfmJrcGVyLWhyZHITCxIGTGVkZ2VyGICAwMWc48ELDA", 1, "group:'Net Income' on:2024", 5, TRUE, FALSE)Each parameter serves a purpose:
- BKPER_BALANCES_PERIOD — The function that fetches totals for a period (as opposed to a point in time).
- First parameter — The bookid identifying the source book.
- 1 — A cache number used to trigger dynamic updates. It is generated and updated automatically; change it manually to force a new fetch.
- “group:‘Net Income’ on:2024” — The query defining which data to retrieve.
- 5 — The depth level in the group hierarchy to fetch.
- TRUE — Transposes the result in the sheet.
- FALSE — Controls whether the date column is hidden.
See also: Financial Statements on Google Sheets